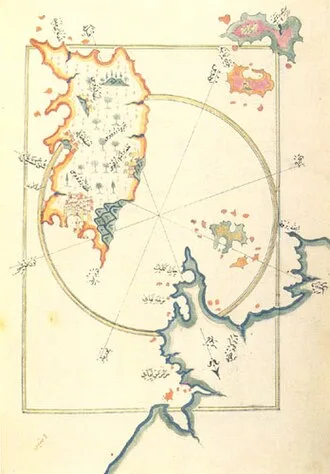
One of the earliest preserved maps is from the Akkadian Empire (in modern Iraq) inscribed on a clay tablet and dated to 2300 BCE. By the 5th century BCE, Greeks were drawing maps of their known world, encompassing the Mediterranean Sea and most of Europe, North Africa, and the Middle East. Maps were important tools in the Age of Discovery, when mariners used them to explore new lands.
Applications of cartography expanded in the late 17th century with the development of thematic maps, which portrayed specific kinds of data – such as rainfall or population density – rather than focusing on geographic features such as rivers, mountains, and cities. The rapid expansion of road networks and mass transit systems in the 20th century created a market for mass-produced maps aimed at the traveling public.
The development of computer cartography and geographic information systems in the mid-20th century enabled the storage of vast amounts of geographic data, which could be dynamically displayed and analyzed. Unlike paper maps, interactive maps let users zoom, pan, and choose which data to view. Geographic data used for mapmaking includes imagery, scanned paper maps, surveying measurements, geographic features, and terrain data.
Designing a map is a complex process involving the selection and arrangement of graphical elements to create a map that is informative, useful, and uncluttered. Because the amount of available geographic data often exceeds what can be effectively displayed, map designers must apply a generalization process to decide which elements to display and which to omit.
The amount of detail is influenced by the map scale, expressed as a ratio between a distance on the map and the corresponding distance on the ground. The choice of a map projection is fundamental, as every projection introduces characteristic distortions. Geographic coordinates may be displayed as latitude and longitude, or in a Cartesian (XY grid) system.
In addition to geographic data, maps may include supplemental elements such as legends (guides to the map's symbols), scale bars, north arrows, or inset maps.
Definition and etymology
The word "map" first appeared in English around 1527 CE. It originates from the Late Latin word mappa ('napkin, cloth') arising from Classical Latin. Alternatively, it may stem from the French mappemonde or the Latin mappa mundi (both 'map of the world').
The meaning of "map" depends on the context. In cartography, early definitions focused on representations of the Earth printed on paper, as in the 1938 definition by the cartographer Erwin Raisz (in the first major book on cartography in English): "a conventionalized picture of the Earth's pattern as seen from above, to which lettering is added for identification".
The advent of computers and interplanetary exploration in the late 20th century led cartographers to adopt definitions that included media other than paper and depictions of things other than the Earth, as in the brief 1976 definition by the cartographer Arthur H. Robinson: "a graphic representation of the milieu". A 1987 definition by the cartographers John Brian Harley and David Woodward is "graphic representations that facilitate a spatial understanding of things, concepts, conditions, processes, or events in the human world".
Later definitions widened to encompass maps as abstract models, such as the 1992 definition "a representation or abstraction of geographical reality: a tool for presenting geographical information in a way that is visual, digital or tactile".
Outside cartography, "map" is used as an analogy or metaphor in a broad range of contexts. In the 19th century, the New English Dictionary (predecessor to the Oxford English Dictionary) included the definition "circumstantial account of a state of things". The Oxford English Dictionary, as of 2026[update], includes the primary definition (a representation of the Earth's surface) and also includes "a diagram or collection of data showing the spatial distribution of something or the relative positions of its components" and the figurative meaning "a conceptualization or mental representation of the structure, extent, or layout of an area of experience, field of study, or ideology". This article focuses on cartographic maps and does not cover metaphorical or figurative uses.
Applications
Maps support a wide variety of functions. Common applications of maps in everyday life include navigation and route planning: they are useful for finding nearby points of interest such as hospitals, gas stations, hotels, restaurants and parks. People planning vacations or outings often rely on maps to identify destinations, using road maps and tourist maps.
Commercial and recreational traffic in the air and on the water uses maps (called "charts" in this context): air traffic relies on aeronautical charts, and water traffic uses nautical charts.
Military and security forces use maps for mission planning, surveillance, border management, and intelligence analysis. Politicians use maps to promote political agendas or propaganda, whether within a nation or in international disputes. In the commercial realm, maps are used for advertising and other persuasive purposes.
Government-related applications include census, elections, administration, and property taxation. Local or regional governments use maps for urban planning, such as designing roads, public transportation, housing developments, and green spaces. Public and private utilities use maps to maintain distribution systems for water, electricity, gas, telecommunications, and sewers.
Emergency, fire, and police services use maps for evacuation planning, dispatching fire or police responders, and coordinating disaster relief. Cadastral maps are essential tools for managing real property boundaries, which are required for monitoring construction progress and creating zoning regulations. Governments also use maps to inform policy decisions about voting district boundaries, labor force analysis, utility service planning, social and educational services, poverty analysis, marketing analysis, flood risk, and agriculture.
Environmental protection and management utilize maps to monitor forests, wildlife habitats, climate change, floods, wildfires, and pollution. Foresters, ranchers, and farmers can use maps to manage land, resources, and forests.
Scientists use maps to manage spatial data when studying subjects such as geology, weather, earthquakes, and population distribution. Maps help public health authorities track disease outbreaks, and scientists map genetic patterns in populations. Educators often use maps as tools when teaching geography, history, environmental science, and spatial thinking.
Journalists frequently use maps in their reporting to help audiences understand the geographic context of stories and events. Maps are sometimes considered things of beauty and displayed as artwork, used as home decorations, or incorporated into a larger work of art.
Digital maps support autonomous navigation and spatial awareness for unmanned aircraft, boats, cars, and robots. These devices can consult a digital map to determine their position (a process called "localization") and to determine a path to their goal. In some applications, unmanned vehicles dynamically create a digital map of their surroundings by exploring their environment; this process is called simultaneous localization and mapping (SLAM).
History
Antiquity to 14th century
It is unknown when or where humans created the first maps. Their appearance in the records of numerous ancient cultures suggests that mapmaking originated in prehistory. One of the earliest preserved maps is inscribed on a clay tablet, dated to 2300 BCE, and found in Nuzi, within the Akkadian Empire (in modern Iraq).
Egyptian maps on papyrus from 1300 BCE show the location of gold mines. A document from China dated 1020 BCE describes maps used for town planning. Early Chinese maps that are still preserved include one from the 4th century BCE engraved on a large bronze sheet, showing the location of five mausoleums, and a set of maps drawn on silk from the 2nd century BCE, which showed more sophistication than contemporary maps originating in Europe.
Around 490 BCE, Greek geographer Hecataeus created a map of his known world, encompassing the Mediterranean Sea and most of Europe, North Africa, and the Middle East. One of the most influential early maps was a world map prepared around 150 CE by the Greco-Roman geographer and scientist Ptolemy. Maps created by the Romans – in contrast to the Greek emphasis on science – were used for political and administrative purposes: in 44 BCE Julius Caesar commissioned a map of the known world, which was prepared by Agrippa.
The Romans also produced the Tabula Peutingeriana, which diagrammed most major roads of their empire. Like many modern transit maps, it is schematic in nature and is not drawn to scale.
A notable set of maps from the Islamic world was the Nuzhat al-Mushtaq ('The Book of Pleasant Journeys into Faraway Lands') – an atlas created in 1154 by Muhammad al-Idrisi, an Arab geographer, at the request of Norman King Roger II. Within medieval Europe, a large number of mappae mundi ('maps of the world') were created and – as Christianity dominated medieval European society – many incorporated religious themes.
Scholars refer to some of the mappae mundi as T-O maps because they depicted the Earth as an "O" shape, containing three continents (Europe, Asia, and Africa) separated by waters in a "T" shape.
15th to 19th centuries
Maps played a major role in the Age of Discovery. On his first voyage in 1492, Christopher Columbus carried a world map created by Paolo dal Pozzo Toscanelli. The map did not include the Americas and greatly underestimated the distance from Europe westward to Asia. That year, Martin Behaim created the Erdapfel (lit. 'Earth apple') – one of the earliest extant globes.
In the 16th century, map accuracy improved with the development of triangulation (initially described by Gemma Frisius in 1533), which advanced surveying techniques by using devices such as plane tables and theodolites to precisely measure angles between lines of sight to landmarks. During this era, cartographers also advanced the study of map projections; notably Gerardus Mercator, who created the Mercator projection in 1569, which proved valuable to navigators because it allowed them to draw a straight line on the map pointing to their destination and reach it by following the indicated compass direction.
When Europeans encountered indigenous peoples in Central and South America and in Oceania, they found maps already in use for navigation, administration, and commerce.
The applications of cartography expanded in the late 17th century with the invention of thematic maps that focused on portraying a specific kind of data – such as rainfall or population density. In the late 18th century, the accuracy of maps increased dramatically with the perfection of clocks that could keep accurate time for extended periods and withstand the violent motions of a ship and the temperature changes of different climates.
These chronometers enabled longitude to be computed accurately at any point on Earth. For example, a voyager could sail to Easter Island and use a chronometer (in conjunction with other equipment, such as a sextant) to determine the precise latitude and longitude of the island. Cartographers could use such positions to prepare accurate maps.
Military applications led to innovations in cartography. In the late 18th century, Napoleon created a corps of geographic engineers to produce topographic maps for military use. The rise of nationalism in the 19th century was reinforced by maps, as noted by the French historian Christian Jacob, who wrote that maps focused on individual nations were "the visual glue of a sense of national identity".
20th century to present
During World War I (WWI), cameras were mounted in airplanes that flew over battlefields and took photographs that were later analyzed for reconnaissance purposes. Some photos were used to update trench maps at scales up to 1:10,000. In the early 20th century, maps were widely used for propaganda by nations such as Soviet Russia and Nazi Germany to promote territorial claims and to exaggerate threats from perceived enemies.
The rapid expansion of road networks and mass transit systems in the 20th century created a market for mass-produced maps aimed at the traveling public. Road maps and transit maps became commonplace, including the 1933 London Underground map, which used an innovative schematic design that was more useful for passengers than a geographically accurate layout.
After WWI, civilian cartographers used aerial photography in conjunction with the new science of photogrammetry to generate maps more rapidly than was possible with ground-based surveying. In the mid-20th century, the study of cartography shifted to a more rigorous and quantitative foundation, emphasizing the fundamentally mathematical nature of the discipline.
Cartography was revolutionized in the latter half of the 20th century as computers and satellites enabled the new fields of computer cartography and remote sensing. Geographic information systems (GIS) allowed vast amounts of geographic data to be dynamically displayed on computer screens, so users could interactively zoom, pan, and choose which data to view.
In the 21st century, maps were commonly displayed on mobile phones, provided by apps such as Google Maps and Apple Maps.
Design
Map design is the process of selecting and arranging imagery and graphic symbols to effectively communicate geographic information. A cartographer must make many choices when designing a map, such as which data to include (or omit), coverage area, legend, orientation (which direction is north), scale, projection, coordinate system, symbols, shapes, colors, labels, and typography. The choices depend on the purpose of the map and its intended audience.
Layout and hierarchy
An important aspect of map design is the layout, which involves arranging the geographic data and the auxiliary elements (such as the title, legend, map scale, and insets). Robinson defines layout as "the process of arriving at proper balance. In a well-balanced design, nothing is too light or too dark, too long or too short, or too small or too large, in the wrong place, or too close to the edge."
The cartographer Cynthia Brewer suggests that a map's design should visually distinguish key elements in a map from less important ones – a consideration called visual hierarchy. The elements with the highest priority in the visual hierarchy are the map title and features related to the map's primary purpose.
Medium priority elements include the background geography. The lowest-priority elements are supplemental notes and information, often found in the margins. Visually, key elements should appear to be in the foreground, while less important ones are in the background – a figure-ground relationship.
The background graphics of a map are called the basemap, and its purpose is to provide context for higher priority elements. The basemap can include landforms, topography, transportation networks, or imagery.
Shape and neatline
Maps can be created in a variety of shapes. A common shape is rectangular, but some polar maps are circular. The edge of a map's geographic content is delimited by a neatline; the region outside the neatline is the margin. Some maps cover a quadrangle, which is a region of the Earth's surface bounded by two parallels (circles of constant latitude) and two meridians (lines of constant longitude).
The neatline (extent) of a map may not use the same coordinate system as the map's data; for example, USGS topographic maps use a latitude/longitude quadrangle for the extent, but Universal Transverse Mercator (UTM) for the map's projection and geographic coordinates. In some maps, the neatline may not be a perfect rectangle or may not have 90-degree corners.
Scale
The scale of a map is a numerical value that indicates how measurements on the map relate to the reality they depict. Map scales are typically stated as a ratio, such as 1:12,000, which means that every centimeter (cm) on the map represents 12,000 cm (or 120 m) on the ground. Scales can be useful in many contexts.
For example, a navigator can measure the distance between two points on a map, and divide by the scale to obtain an approximate value of the distance between the two points in the world.
Maps can be classified as "small scale" (lower resolution, covering large areas) or "large scale" (higher resolution, covering small areas). There is no official dividing line between large and small scales, although 1:500,000 or 1:1,000,000 are sometimes used as partitions. In some contexts, a third term – "medium scale" – may be used for maps with scales ranging from about 1:250,000 to 1:1,000,000.
Because map projections introduce distortion when the Earth's curved surface is represented on a flat map, the scale of a map always varies across the map. For large-scale maps that cover a small region, these variations are generally small, and the scale can often be treated as constant across the map. For small-scale maps that cover large areas like continents or the whole Earth, the variations in scale can be large, and the scale should be treated as merely a nominal value.
The notion of scale is closely related to the concept of resolution, which is the granularity or precision with which locations are measured. Some cartographers define the resolution of a paper map as the distance represented by half a millimeter on the map. For example, a 1:10,000 scale map has a resolution of 5 m; and a 1:1,000,000 scale map has a resolution of 500 m.
Map scales were originally used in the context of paper maps, where the ratio of map to reality has an unambiguous definition. However, scales can also be applied to digital map databases. Since a database does not have a definitive paper representation, the scale is instead based on the resolution of the database's feature coordinate values.
For example, a database that contains features stored with a 5 m resolution could be considered to have a scale of 1:10,000. The same process is used to define the scale of a raster image of the Earth: for example, an image with each pixel representing 2 km would correspond to a map scale of 1:4,000,000.